
#TL;DR
Our MongoDB Cluster is running in version 4.4.1.
You can connect to it using MongoDB Compass, the Mongo Shell, SQL or any MongoDB driver supporting at least MongoDB 4.4 with the following URI:
1 mongodb+srv://readonly:readonly@covid-19.hip2i.mongodb.net/covid19
readonlyis the username and the password, they are not meant to be replaced.
#Updates
#December 10th, 2020
- Upgraded the cluster to 4.4.
Improved the python data import script to calculate the daily values using the existing cumulative values with an Aggregation Pipeline.
- confirmed_daily.
- deaths_daily.
- recovered_daily.
#May 13th, 2020
- Renamed the field "city" to "county" and "cities" to "counties" where appropriate. They contains the data from the column "Admin2" in JHU CSVs.
#May 6th, 2020
- The
covid19database now has 5 collections. More details in our README.md. - The
covid19.statisticscollection is renamedcovid19.global_and_usfor more clarity. - Maxime's Charts are now using the
covid19.global_and_uscollection. - The dataset is updated hourly so any commit done by JHU will be reflected at most one hour later in our cluster.
#Table of Contents
#Introduction
As the COVID-19 pandemic has swept the globe, the work of JHU (Johns Hopkins University) and its COVID-19 dashboard has become vitally important in keeping people informed about the progress of the virus in their communities, in their countries, and in the world.
JHU not only publishes their dashboard, but they make the data powering it freely available for anyone to use. However, their data is delivered as flat CSV files which you need to download each time to then query. We've set out to make that up-to-date data more accessible so people could build other analyses and applications directly on top of the data set.
We are now hosting a service with a frequently updated copy of the JHU data in MongoDB Atlas, our database in the cloud. This data is free for anyone to query using the MongoDB Query language and/or SQL. We also support a variety of BI tools directly so you can query the data with Tableau, Qlik and Excel.
With the MongoDB COVID-19 dataset there will be no more manual downloads and no more frequent format changes. With this data set, this service will deliver a consistent JSON and SQL view every day with no downstream ETL required.
None of the actual data is modified. It is simply structured to make it easier to query by placing it within a MongoDB Atlas cluster and by creating some convenient APIs.
#The MongoDB Dataset
All the data we use to create the MongoDB COVID-19 dataset comes from the JHU dataset. In their turn, here are the sources they are using:
- the World Health Organization,
- the National Health Commission of the People's Republic of China,
- the United States Centre for Disease Control,
- the Australia Government Department of Health,
- the European Centre for Disease Prevention and Control,
- and many others.
You can read the full list on their GitHub repository.
Using the CSV files they provide, we are producing two different databases in our cluster.
covid19jhucontains the raw CSV files imported with the mongoimport tool,covid19contains the same dataset but with a clean MongoDB schema design with all the good practices we are recommending.
Here is an example of a document in the covid19 database:
1 { 2 "_id" : ObjectId("5e957bfcbd78b2f11ba349bf"), 3 "uid" : 312, 4 "country_iso2" : "GP", 5 "country_iso3" : "GLP", 6 "country_code" : 312, 7 "state" : "Guadeloupe", 8 "country" : "France", 9 "combined_name" : "Guadeloupe, France", 10 "population" : 400127, 11 "loc" : { 12 "type" : "Point", 13 "coordinates" : [ -61.551, 16.265 ] 14 }, 15 "date" : ISODate("2020-04-13T00:00:00Z"), 16 "confirmed" : 143, 17 "deaths" : 8, 18 "recovered" : 67 19 }
The document above was obtained by joining together the file UID_ISO_FIPS_LookUp_Table.csv and the CSV files time series you can find in this folder.
Some fields might not exist in all the documents because they are not relevant or are just not provided by JHU. If you want more details, run a schema analysis with MongoDB Compass on the different collections available.
If you would prefer to host the data yourself, the scripts required to download and transform the JHU data are open-source. You can view them and instructions for how to use them on our GitHub repository.
In the covid19 database, you will find 5 collections which are detailed in our Github repository README.md file.
- metadata
- global (the data from the time series global files)
- us_only (the data from the time series US files)
- global_and_us (the most complete one)
- countries_summary (same as global but countries are grouped in a single doc for each date)
#Get Started
You can begin exploring the data right away without any MongoDB or programming experience using MongoDB Charts or MongoDB Compass.
In the following sections, we will also show you how to consume this dataset using the Java, Node.js and Python drivers.
We will show you how to perform the following queries in each language:
- Retrieve the last 5 days of data for a given place,
- Retrieve all the data for the last day,
- Make a geospatial query to retrieve data within a certain distance of a given place.
#Explore the Dataset with MongoDB Charts
With Charts, you can create visualisations of the data using any of the pre-built graphs and charts. You can then arrange this into a unique dashboard, or embed the charts in your pages or blogs.
If you want to create your own MongoDB Charts dashboard, you will need to set up your own Free MongoDB Atlas cluster and import the dataset in your cluster using the import scripts or use
mongoexport & mongoimportormongodump & mongorestore. See this section for more details: Take a copy of the data.
#Explore the Dataset with MongoDB Compass
Compass allows you to dig deeper into the data using the MongoDB Query Language or via the Aggregation Pipeline visual editor. Perform a range of operations on the data, including mathematical, comparison and groupings. Create documents that provide unique insights and interpretations. You can use the output from your pipelines as data-sources for your Charts.
For MongoDB Compass or your driver, you can use this connection string.
1 mongodb+srv://readonly:readonly@covid-19.hip2i.mongodb.net/covid19
#Explore the Dataset with the MongoDB Shell
Because we store the data in MongoDB, you can also access it via the MongoDB Shell or using any of our drivers. We've limited access to these collections to 'read-only'. You can find the connection strings for the shell and Compass below, as well as driver examples for Java, Node.js, and Python to get you started.
1 mongo "mongodb+srv://covid-19.hip2i.mongodb.net/covid19" --username readonly --password readonly
#Accessing the Data with Java
Our Java examples are available in our Github Repository Java folder.
#With the MongoDB Driver
Here is the main class of our Java example. Of course, you need the three POJOs from the Java Github folder to make this work.
1 package com.mongodb.coronavirus; 2 3 import com.mongodb.ConnectionString; 4 import com.mongodb.MongoClientSettings; 5 import com.mongodb.client.MongoClient; 6 import com.mongodb.client.MongoClients; 7 import com.mongodb.client.MongoCollection; 8 import com.mongodb.client.MongoDatabase; 9 import org.bson.codecs.configuration.CodecRegistry; 10 import org.bson.codecs.pojo.PojoCodecProvider; 11 import org.bson.conversions.Bson; 12 13 import java.util.Date; 14 15 import static com.mongodb.client.model.Filters.*; 16 import static com.mongodb.client.model.Sorts.descending; 17 import static org.bson.codecs.configuration.CodecRegistries.fromProviders; 18 import static org.bson.codecs.configuration.CodecRegistries.fromRegistries; 19 20 public class MongoDB { 21 22 public static void main(String[] args) { 23 try (MongoClient client = MongoClients.create(getMongoClient())) { 24 int earthRadius = 6371; 25 MongoDatabase db = client.getDatabase("covid19"); 26 MongoCollection<GlobalAndUs> globalAndUsCollection = db.getCollection("global_and_us", GlobalAndUs.class); 27 MongoCollection<Metadata> metadataCollection = db.getCollection("metadata", Metadata.class); 28 29 System.out.println("Query to get the last 5 entries for France (continent only)"); 30 Bson franceFilter = eq("country", "France"); 31 Bson noStateFilter = eq("state", null); 32 globalAndUsCollection.find(and(franceFilter, noStateFilter)) 33 .sort(descending("date")) 34 .limit(5) 35 .forEach(System.out::println); 36 37 System.out.println("\nQuery to get the last day data (limited to 5 docs here)."); 38 Metadata metadata = metadataCollection.find().first(); 39 Date lastDate = metadata.getLastDate(); 40 Bson lastDayFilter = eq("date", lastDate); 41 globalAndUsCollection.find(lastDayFilter).limit(5).forEach(System.out::println); 42 43 System.out.println("\nQuery to get the last day data for all the countries within 500km of Paris."); 44 Bson aroundParisFilter = geoWithinCenterSphere("loc", 2.341908, 48.860199, 500.0 / earthRadius); 45 globalAndUsCollection.find(and(lastDayFilter, aroundParisFilter)).forEach(System.out::println); 46 47 System.out.println("\nPrint the Metadata summary."); 48 metadataCollection.find().forEach(System.out::println); 49 } 50 } 51 52 private static MongoClientSettings getMongoClient() { 53 String connectionString = "mongodb+srv://readonly:readonly@covid-19.hip2i.mongodb.net/covid19"; 54 CodecRegistry pojoCodecRegistry = fromProviders(PojoCodecProvider.builder().automatic(true).build()); 55 CodecRegistry codecRegistry = fromRegistries(MongoClientSettings.getDefaultCodecRegistry(), pojoCodecRegistry); 56 return MongoClientSettings.builder() 57 .applyConnectionString(new ConnectionString(connectionString)) 58 .codecRegistry(codecRegistry) 59 .build(); 60 } 61 }
#Accessing the Data with Node.js
Our Node.js examples are available in our Github Repository Node.js folder.
#With the MongoDB Driver
Check out the instructions in the Node.js folder.
1 const MongoClient = require("mongodb").MongoClient; 2 3 const uri = 4 "mongodb+srv://readonly:readonly@covid-19.hip2i.mongodb.net/covid19"; 5 6 const client = new MongoClient(uri, { 7 useNewUrlParser: true, 8 useUnifiedTopology: true, 9 }); 10 11 client.connect((err) => { 12 const covid19Database = client.db("covid19"); 13 const globalAndUS = covid19Database.collection("global_and_us"); 14 const metadata = covid19Database.collection("metadata"); 15 16 // Query to get the last 5 entries for France (continent only) 17 globalAndUS 18 .find({ country: "France" }) 19 .sort(["date", -1]) 20 .limit(15) 21 .toArray((err, docs) => { 22 if (err) { 23 console.error(err); 24 } 25 console.log(docs); 26 }); 27 28 //Query to get the last day data (limited to 5 docs here). 29 metadata 30 .find() 31 .toArray((err, docs) => { 32 if (err) { 33 console.error(err); 34 } 35 const lastDate = docs[0].last_date; 36 37 globalAndUS 38 .find({ date: { $eq: lastDate } }) 39 .limit(5) 40 .toArray((err, docs) => { 41 if (err) { 42 console.error(err); 43 } 44 console.log(docs); 45 }); 46 }); 47 48 // Query to get the last day data for all the countries within 500km of Paris. 49 const lon = 2.341908; 50 const lat = 48.860199; 51 const earthRadius = 6371; // km 52 const searchRadius = 500; // km 53 54 metadata 55 .find() 56 .toArray((err, docs) => { 57 if (err) { 58 console.error(err); 59 } 60 const lastDate = docs[0].last_date; 61 62 globalAndUS 63 .find({ 64 date: { $eq: lastDate }, 65 loc: { 66 $geoWithin: { 67 $centerSphere: [[lon, lat], searchRadius / earthRadius], 68 }, 69 }, 70 }) 71 .limit(5) 72 .toArray((err, docs) => { 73 if (err) { 74 console.error(err); 75 } 76 console.log(docs); 77 }); 78 }); 79 });
#Accessing the Data with Python
Our Python examples are available in our Github Repository Python folder.
#With the MongoDB Driver
See all the instructions to get started in the Python folder.
1 #!python3 2 3 import pymongo 4 from pymongo import MongoClient 5 from tabulate import tabulate 6 7 EARTH_RADIUS = 6371.0 8 MDB_URL = "mongodb+srv://readonly:readonly@covid-19.hip2i.mongodb.net/covid19" 9 10 11 def main(): 12 client = MongoClient(MDB_URL) 13 db = client.get_database("covid19") 14 stats = db.get_collection("global_and_us") 15 metadata = db.get_collection("metadata") 16 17 # Get some results for the UK: 18 print("\nMost recent 10 global_and_us for the UK:") 19 results = ( 20 stats.find({"country": "United Kingdom", "state": None}) 21 .sort("date", pymongo.DESCENDING) 22 .limit(10) 23 ) 24 print_table(["date", "confirmed", "deaths"], results) 25 26 # Get the last date loaded: 27 meta = metadata.find_one() 28 last_date = meta["last_date"] 29 30 # Show the 5 locations with the most recovered cases: 31 print("\nThe last day's highest reported recoveries:") 32 results = ( 33 stats.find({"date": last_date}).sort("recovered", pymongo.DESCENDING).limit(5) 34 ) 35 print_table(["combined_name", "recovered"], results) 36 37 # Confirmed cases for all countries within 500km of Paris: 38 print( 39 "\nThe last day's confirmed cases for all the countries within 500km of Paris:" 40 ) 41 results = stats.find( 42 { 43 "date": last_date, 44 "loc": { 45 "$geoWithin": { 46 "$centerSphere": [[2.341908, 48.860199], 500.0 / EARTH_RADIUS] 47 } 48 }, 49 } 50 ) 51 print_table(["combined_name", "confirmed"], results) 52 53 54 def print_table(doc_keys, search_results, headers=None): 55 """
Utility function to print a query result as a table.
Params:
doc_keys: A list of keys for data to be extracted from each document.
search_results: A MongoDB cursor.
headers: A list of headers for the table. If not provided, attempts to
generate something sensible from the provided `doc_keys`
""" 56 if headers is None: 57 headers = [key.replace("_", " ").replace("-", " ").title() for key in doc_keys] 58 records = (extract_tuple(doc, doc_keys) for doc in search_results) 59 print(tabulate(records, headers=headers)) 60 61 62 def extract_tuple(mapping, keys): 63 """
Extract a tuple from a mapping by requesting a sequence of keys.
Missing keys will result in `None` values in the resulting tuple.
""" 64 return tuple([mapping.get(key) for key in keys]) 65 66 67 if __name__ == "__main__": 68 main()
#Accessing the Data with Golang
Our Golang examples are available in our Github Repository Golang folder.
#With the MongoDB Driver
See all the instructions to get started in the Golang folder.
1 package main 2 3 import ( 4 "context" 5 "fmt" 6 "os" 7 "strconv" 8 "time" 9 10 "github.com/olekukonko/tablewriter" 11 "go.mongodb.org/mongo-driver/bson" 12 "go.mongodb.org/mongo-driver/bson/primitive" 13 "go.mongodb.org/mongo-driver/mongo" 14 "go.mongodb.org/mongo-driver/mongo/options" 15 ) 16 17 const mdbURL = "mongodb+srv://readonly:readonly@covid-19.hip2i.mongodb.net/covid19" 18 const earthRadius = 6371.0 19 20 // Metadata represents (a subset of) the data stored in the metadata 21 // collection in a single document. 22 type Metadata struct { 23 LastDate time.Time `bson:"last_date"` 24 // There are other fields in this document, but this sample code doesn't 25 // use them. 26 } 27 28 // GlobalAndUS represents the document structure of documents in the 29 // 'global_and_us' collection. 30 type GlobalAndUS struct { 31 ID primitive.ObjectID `bson:"_id"` 32 UID int32 33 34 // Location: 35 CombinedName string `bson:"combined_name"` 36 County string 37 State string 38 Country string 39 CountryCode int32 `bson:"country_code"` 40 CountryISO2 string `bson:"country_iso2"` 41 CountryISO3 string `bson:"country_iso3"` 42 FIPS int32 43 Loc struct { 44 Type string 45 Coordinates []float64 46 } 47 48 Date time.Time 49 50 // Statistics: 51 Confirmed int32 52 Deaths int32 53 Population int32 54 Recovered int32 55 } 56 57 // main is the entrypoint for this binary. 58 // It connects to MongoDB but most of the interesting code is in other functions. 59 func main() { 60 ctx, cancel := context.WithTimeout(context.Background(), 10*time.Second) 61 defer cancel() 62 client, err := mongo.Connect(ctx, options.Client().ApplyURI(mdbURL)) 63 if err != nil { 64 panic(fmt.Sprintf("Error initializing MongoDB Client: %v", err)) 65 } 66 defer client.Disconnect(ctx) 67 68 // Get references to the main collections: 69 database := client.Database("covid19") 70 global_and_us := database.Collection("global_and_us") 71 metadata := database.Collection("metadata") 72 73 // Print some interesting results: 74 fmt.Println("\nMost recent 10 global_and_us for United Kingdom:") 75 recentCountryStats(global_and_us, "United Kingdom") 76 lastDate := mostRecentDateLoaded(metadata) 77 fmt.Printf("\nLast date loaded: %v\n", lastDate) 78 fmt.Println("\nThe last day's highest reported recoveries:") 79 highestRecoveries(global_and_us, lastDate) 80 fmt.Println("\nThe last day's confirmed cases for all the countries within 500km of Paris:") 81 confirmedWithinRadius(global_and_us, lastDate, 2.341908, 48.860199, 500.0) 82 } 83 84 // recentCountryStats prints the most recent 10 stats for a country. 85 // Note that this won't work for "US" because that data is broken down by county & state. 86 func recentCountryStats(global_and_us *mongo.Collection, country string) { 87 ctx, cancel := context.WithTimeout(context.Background(), 30*time.Second) 88 defer cancel() 89 findOptions := options.Find().SetSort(bson.D{{"date", -1}}).SetLimit(10) 90 cur, err := global_and_us.Find(ctx, bson.D{{"country", country}, {"state", nil}}, findOptions) 91 if err != nil { 92 panic(err) 93 } 94 defer cur.Close(ctx) 95 adapter := func(s GlobalAndUS) []string { 96 return []string{ 97 s.Date.String(), 98 strconv.Itoa(int(s.Confirmed)), 99 strconv.Itoa(int(s.Recovered)), 100 strconv.Itoa(int(s.Deaths)), 101 } 102 } 103 printTable(ctx, []string{"Date", "Confirmed", "Recovered", "Deaths"}, cur, adapter) 104 } 105 106 // mostRecentDateLoaded gets the date of the last data loaded into the database 107 // from the 'metadata' collection. 108 func mostRecentDateLoaded(metadata *mongo.Collection) time.Time { 109 var meta Metadata 110 ctx, cancel := context.WithTimeout(context.Background(), 30*time.Second) 111 defer cancel() 112 if err := metadata.FindOne(ctx, bson.D{}).Decode(&meta); err != nil { 113 panic(fmt.Sprintf("Error loading metadata document: %v", err)) 114 } 115 return meta.LastDate 116 } 117 118 // highestRecoveries prints the top 5 countries with the most recoveries. 119 func highestRecoveries(global_and_us *mongo.Collection, date time.Time) { 120 /// The last day's highest reported recoveries 121 opts := options.Find().SetSort(bson.D{{"recovered", -1}}).SetLimit(5) 122 ctx, cancel := context.WithTimeout(context.Background(), 30*time.Second) 123 defer cancel() 124 cur, err := global_and_us.Find(ctx, bson.D{{"date", date}}, opts) 125 if err != nil { 126 panic(err) 127 } 128 defer cur.Close(ctx) 129 adapter := func(s GlobalAndUS) []string { 130 return []string{s.CombinedName, strconv.Itoa(int(s.Recovered))} 131 } 132 printTable(ctx, []string{"Country", "Recovered"}, cur, adapter) 133 } 134 135 // Confirmed cases for all countries within radius km of a lon/lat coordinate: 136 func confirmedWithinRadius(global_and_us *mongo.Collection, date time.Time, lon float64, lat float64, radius float64) { 137 center := bson.A{lon, lat} 138 locationExpr := bson.E{ 139 "loc", bson.D{{ 140 "$geoWithin", bson.D{{ 141 "$centerSphere", bson.A{center, radius / earthRadius}, 142 }}, 143 }}, 144 } 145 ctx, cancel := context.WithTimeout(context.Background(), 30*time.Second) 146 defer cancel() 147 cur, err := global_and_us.Find(ctx, bson.D{{"date", date}, locationExpr}) 148 if err != nil { 149 panic(err) 150 } 151 defer cur.Close(ctx) 152 adapter := func(s GlobalAndUS) []string { 153 return []string{s.CombinedName, strconv.Itoa(int(s.Confirmed))} 154 } 155 printTable(ctx, []string{"Country", "Confirmed"}, cur, adapter) 156 } 157 158 // printTable prints the results of a global_and_us query in a table. 159 // headings provides the heading cell contents 160 // mapper is a function which maps GlobalAndUS structs to a string array of values to be displayed in the table. 161 func printTable(ctx context.Context, headings []string, cursor *mongo.Cursor, mapper func(GlobalAndUS) []string) { 162 table := tablewriter.NewWriter(os.Stdout) 163 table.SetHeader(headings) 164 165 for cursor.Next(ctx) { 166 var result GlobalAndUS 167 err := cursor.Decode(&result) 168 if err != nil { 169 panic(err) 170 } 171 172 table.Append(mapper(result)) 173 } 174 if err := cursor.Err(); err != nil { 175 panic(err) 176 } 177 178 table.Render() 179 }
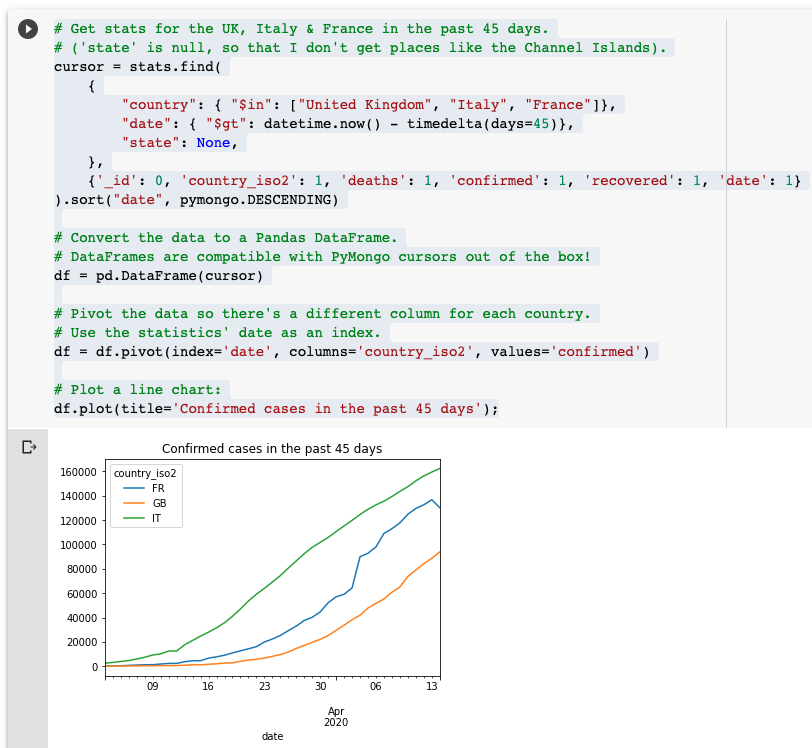
#Accessing the Data with Google Colaboratory
If you have a Google account, a great way to get started is with our Google Colab Notebook.
The sample code shows how to install pymongo and use it to connect to the MongoDB COVID-19 dataset. There are some example queries which show how to query the data and display it in the notebook, and the last example demonstrates how to display a chart using Pandas & Matplotlib!
If you want to modify the notebook, you can take a copy by selecting "Save a copy in Drive ..." from the "File" menu, and then you'll be free to edit the copy.
#Accessing the Data with Business Intelligence Tools
You can get lots of value from the dataset without any programming at all. We've enabled the Atlas BI Connector, which exposes an SQL interface to MongoDB's document structure. This means you can use data analysis and dashboarding tools like Tableau, Qlik Sense, and even MySQL Workbench to analyze, visualise and extract understanding from the data.
Here's an example of a visualisation produced in a few clicks with Tableau:
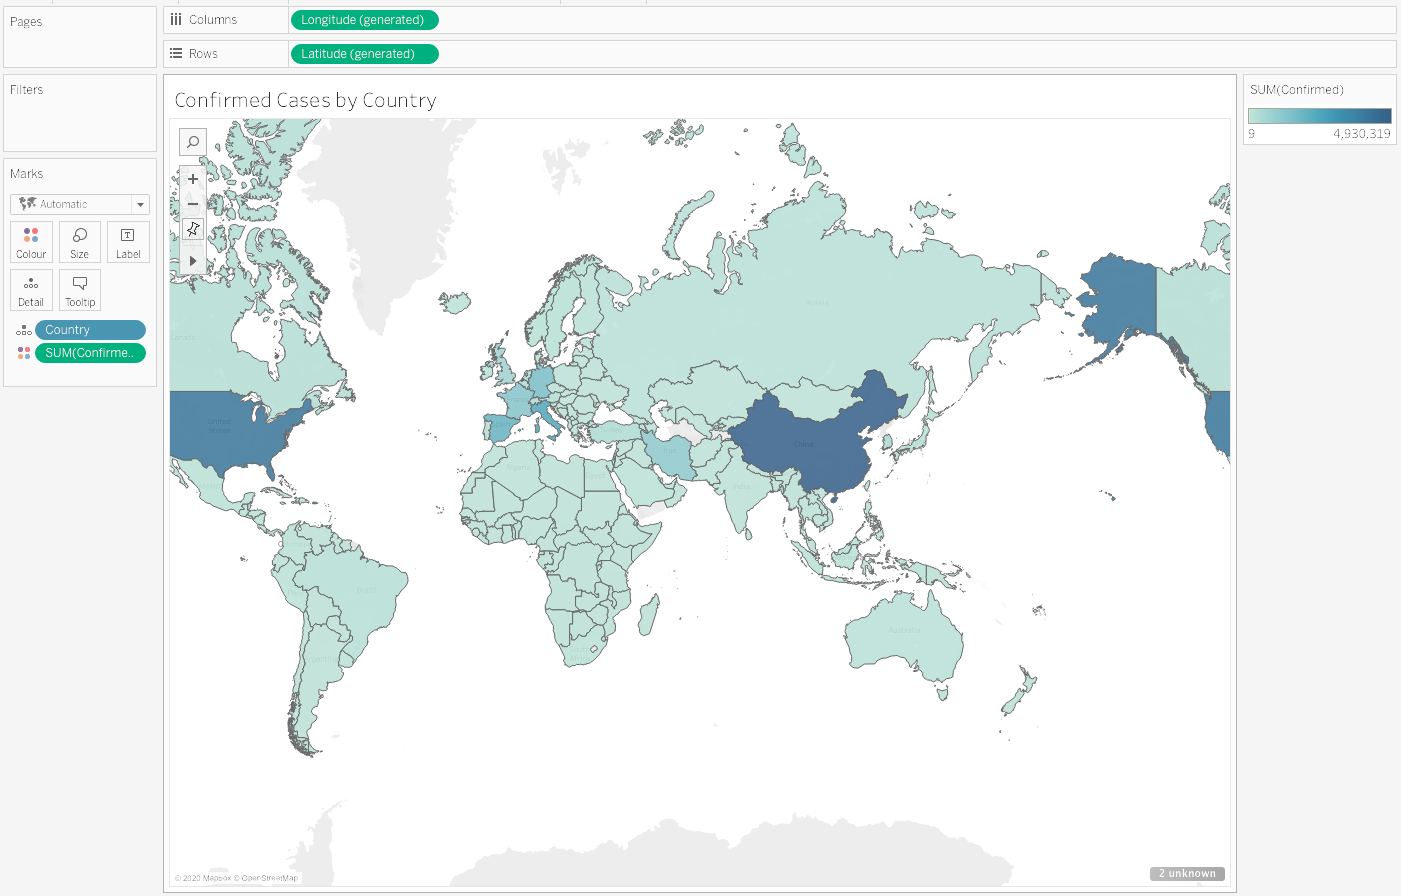
Tableau is a powerful data visualisation and dashboard tool, and can be connected to our COVID-19 data in a few steps. We've written a short tutorial to get you up and running.
#Accessing the Data with any SQL tool
As mentioned above, the Atlas BI Connector is activated so you can connect any SQL tool to this cluster using the following connection information:
- Server: covid-19-biconnector.hip2i.mongodb.net,
- Port: 27015,
- Database: covid19 or covid19jhu (depends which version of the dataset you want to see),
- Username: readonly or readonly?source=admin,
- Password: readonly.
#Take a copy of the data
Accessing our copy of this data in a read-only database is useful,
but it won't be enough if you want to integrate it with other data within a single MongoDB cluster.
You can obtain a copy of the database, either to use offline using a different tool outside of MongoDB, or to load into your own MongoDB instance.
mongoexport is a command-line tool that produces a JSONL or CSV export of data stored in a MongoDB instance.
First, follow these instructions to install the MongoDB Database Tools.
Now you can run the following in your console to download the metadata and global_and_us collections as jsonl files in your current directory:
1 mongoexport --collection='global_and_us' --out='global_and_us.jsonl' --uri="mongodb+srv://readonly:readonly@covid-19.hip2i.mongodb.net/covid19" 2 mongoexport --collection='metadata' --out='metadata.jsonl' --uri="mongodb+srv://readonly:readonly@covid-19.hip2i.mongodb.net/covid19"
Use the
--jsonArrayoption if you prefer to work with a JSON array rather than a JSONL file.
Documentation for all the features of mongoexport is available on the MongoDB website and with the command mongoexport --help.
Once you have the data on your computer, you can use it directly with local tools, or load it into your own MongoDB instance using mongoimport.
1 mongoimport --collection='global_and_us' --uri="mongodb+srv://<user>:<password>@<your-cluster>.mongodb.net/covid19" global_and_us.jsonl 2 mongoimport --collection='metadata' --uri="mongodb+srv://<user>:<password>@<your-cluster>.mongodb.net/covid19" metadata.jsonl
Note that you cannot run these commands against our cluster because the user we gave you (
readonly:readonly) doesn't have write permission on this cluster.Read our Getting Your Free MongoDB Atlas Cluster blog post if you want to know more.
Another smart way to duplicate the dataset in your own cluster would be to use mongodump and mongorestore. Apart from being more efficient, it will also grab the indexes definition along with the data.
1 mongodump --uri="mongodb+srv://readonly:readonly@covid-19.hip2i.mongodb.net/covid19" 2 mongorestore --drop --uri="<YOUR_URI>"
#Wrap up
We see the value and importance of making this data as readily available to everyone as possible, so we're not stopping here. Over the coming days, we'll be adding a GraphQL and REST API, as well as making the data available within Excel and Google Sheets.
We've also launched an Atlas credits program for anyone working on detecting, understanding, and stopping the spread of COVID-19.
If you are having any problems accessing the data or have other data sets you would like to host please contact us on the MongoDB community. We would also love to showcase any services you build on top of this data set. Finally please send in PRs for any code changes you would like to make to the examples.
You can also reach out to the authors directly (Aaron Bassett, Joe Karlsson, Mark Smith, and Maxime Beugnet) on Twitter.